New Features
Version: 4.4.1
July 25th, 2023
Compatibility with LINK Satellite Controllers:
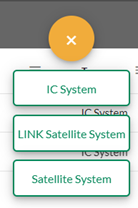
This build will allow users to add a new interface compatible with LINK satellites such as the PAR+ES LINK. When in the “Interface” section and you click on the “+” sign to add an interface, you will see a new choice available called “LINK Satellite System”:
Once you have added this interface, you will be prompted to give it a name and the connection type. Once saved, you will be able to add LINK satellites and stations. If you need help for configuring your hardwired satellites, please reach out to our GSP Team at 1-866-477-9778.
LINK Diagnostics
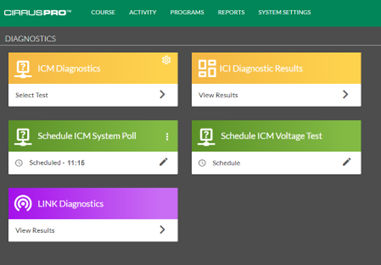
With LINK satellites compatibility, a “LINK Diagnostics” section was added to the System Settings / Diagnostics area.
The LINK Diagnostics screen allows the user to view the signal quality per Interface, Group, satellite and channels. Each section can be expanded by clicking on the small chevron located on the left of each grouping:
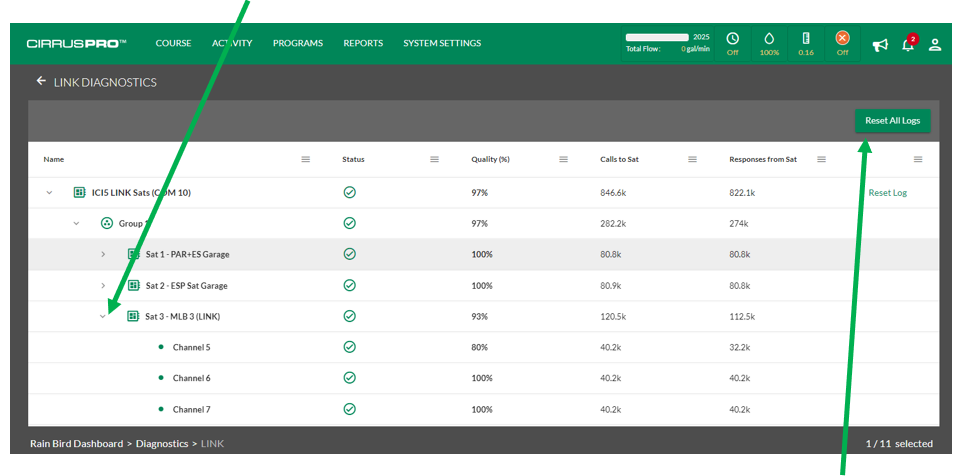
The user can clear the diagnostics results by clicking on either the “Reset All Logs” button, or the logs for just one interface when clicking on the “Reset Log” button located to the far right of the interface.
Compatibility with PAR+ and ESP-SAT-LINK Satellite Controllers:
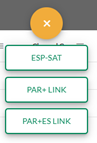
This build will allow users to add PAR+ satellite controllers, as well as ESP-SAT-LINK controllers for adding sensors such as a tipping bucket Rain Can, increasing the compatibility with Legacy products. When in the satellite definition screen and clicking on the “+” sign to add a satellite, you now have the choice to add an ESP-SAT, a PAR+ or a PAR+ES satellite controller to your system.
Hole Tree:
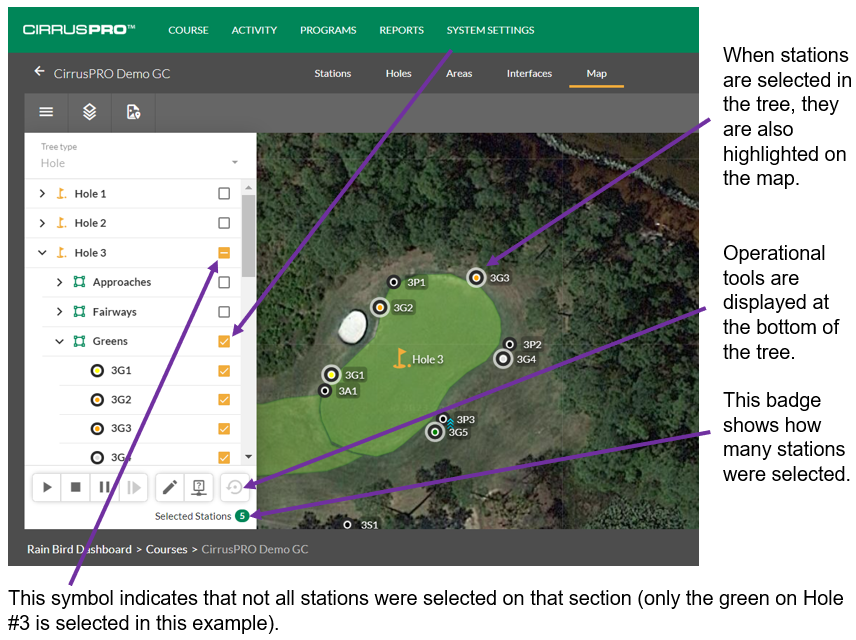
When in your Map, the “Hole Tree” on the top left now allows you to select stations directly in the tree and perform operations such as Start, Pause, Run Diagnostics and perform “Batch Edits” directly from the map! In the example below, the tree is expanded to show Hole #3 Green with its stations selected.
Moving IC Stations to Another ICI:
With this build, it is possible to move IC stations from one interface to another. To access this feature, you must navigate to the Course/Interface section and then click on the name of the interface that the stations are currently located on (the name of the interface is a green link).
This will result in listing all the stations currently attached to that interface. From there, if needed, you can filter by Holes and by Areas:
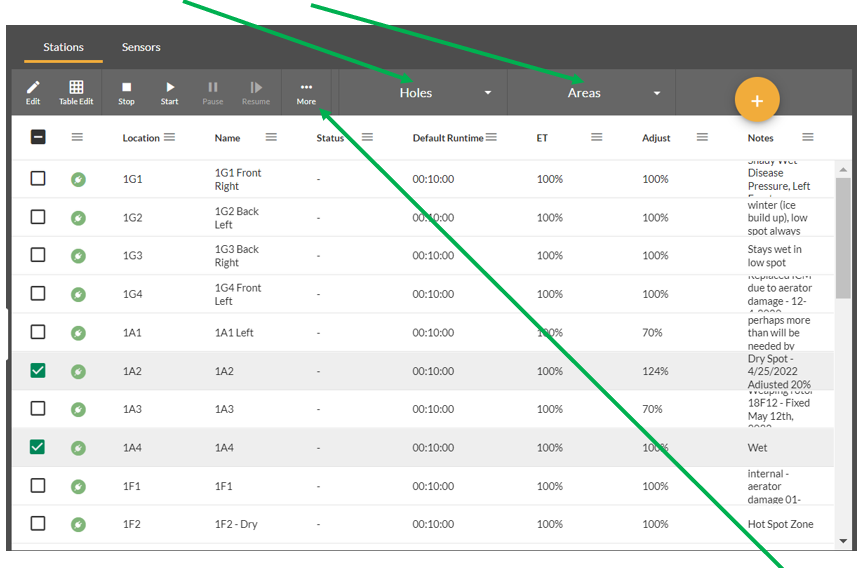
Select the stations you want to move (1A2 and 1A4 in the example above), click on the three dots and select “Change ICI”. You will then be asked to select the new ICI and wire path where these stations will be moved to.
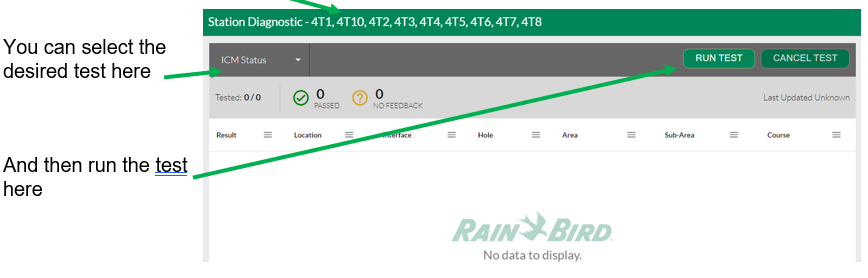
Multi-Station Diagnostics:
It is now possible to select multiple stations from the map either by using the “Multi-Select” tool, or the “Tree View” and perform diagnostics for the selected stations.
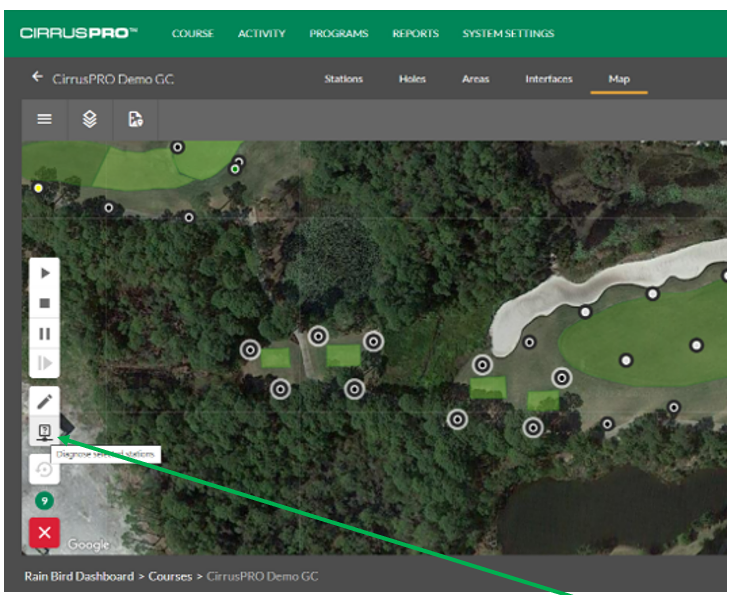
In the example above, all the Tee stations were selected. Clicking on the “Diagnostics” icon will allow you to perform diagnostics on these stations. When clicking on the “Diagnostics” icon, the stations you selected are listed in the top of the diagnostics window.
Batch Edit from the Map:
Very similarly to the function just described above, you can multi-select stations from the map using either the “Multi-Select” tool, or the “Tree View” and perform a Batch Edit on these stations.
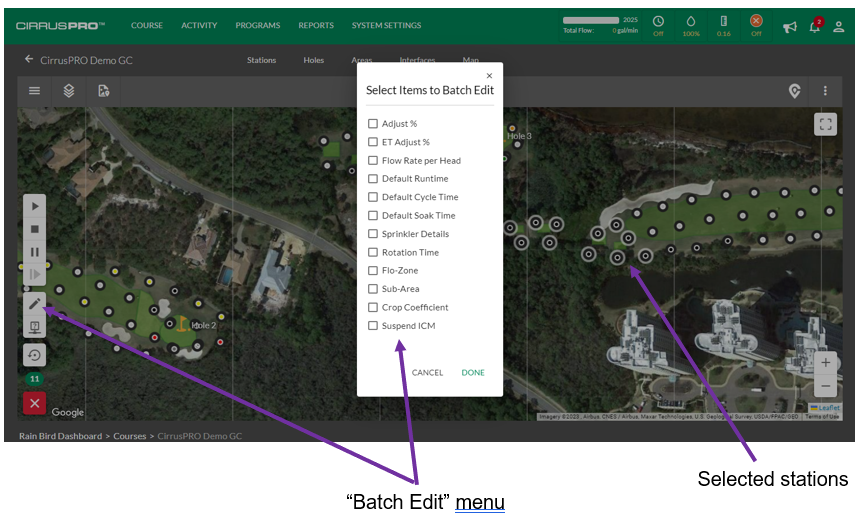
In the example above, all the Tee stations were selected. Clicking on the “Edit” icon will bring up the batch edit menu for these stations. Then simply select which criteria you want to edit (one or more) and click “Done”. This will bring up the editing menu listing the selected criteria for you to edit.
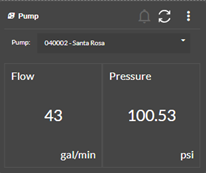
Pump Widget:
Build 4.4 includes a new Pump Widget that allows users to connect to their pump station to display pressure, flow and any alarms that the station could be experiencing. In order for that widget to work, the customer must have a pump station equipped with the MCA monitoring option.
Viewing Separate Pumps in Flow Graph:
When looking at your flow data from the “Flow Log Graph” report in the “Reports” section, it is now possible to view both theoretical and actual flow for each pump separately when your system is equipped with flow seosors reporting each station’s actual flow.
When in the “Flow Graph Log” report, make sure to select all your available flow sensors from the “Select Flow Sensors” menu:

Select the date/time window for your report, enable the “Show Separate Pumps” feature and click on “Run Report”.
Below is an example of s system running 4 different water sources:
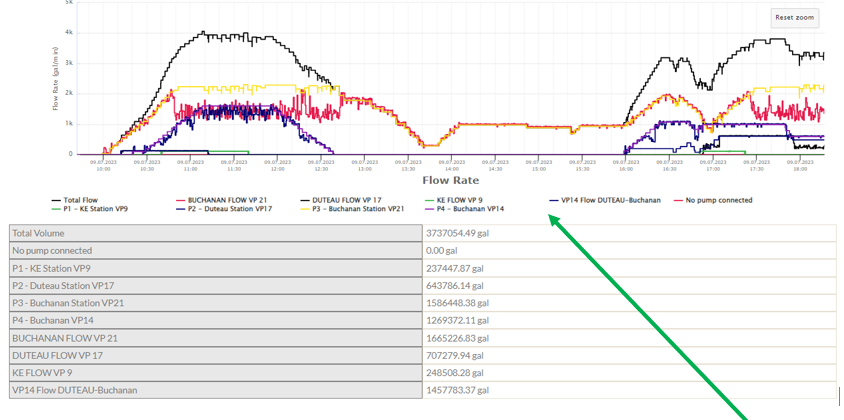
The graph area shows 10 colored lines representing the entire system. The black line represents the system’s total theoretical flow. A legend for all the other lines is shown here and it is possible to click any of these different items to turn “on or off” the matching lines on the graph.
Any source starting with “P” represents the theoretical value for that pump source (such as P1 being Pump #1). The line labelled “No pump connected” will display the flow for any stations that is not assigned to a pump station within Flo-Manager.
So, if this customer wants to compare Theoretical vs. Actual flow for his “Buchanon” water source, he would need to select the “Buchannon flow” line as well as the “P3 – Buchanon” line. The result would look like this:
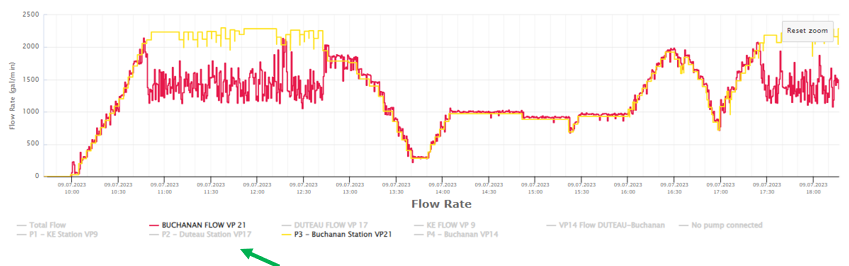
Notice that the lines that are not selected are greyed out.
There is a section at the bottom if the graph showing the total cumulative flow values for each of these lines:
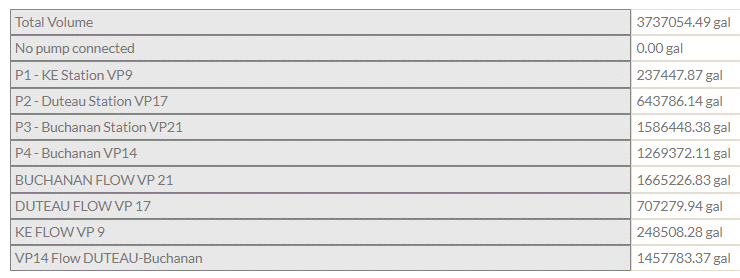
Note that in this system, all the stations have been assigned to a flow zone, so the “No pump connected” totalizer shows a “0.00 gal” result.
Note that it is our intent to have this feature also available in the “Activity / Active” section of CirrusPRO but it is not yet fully completed.
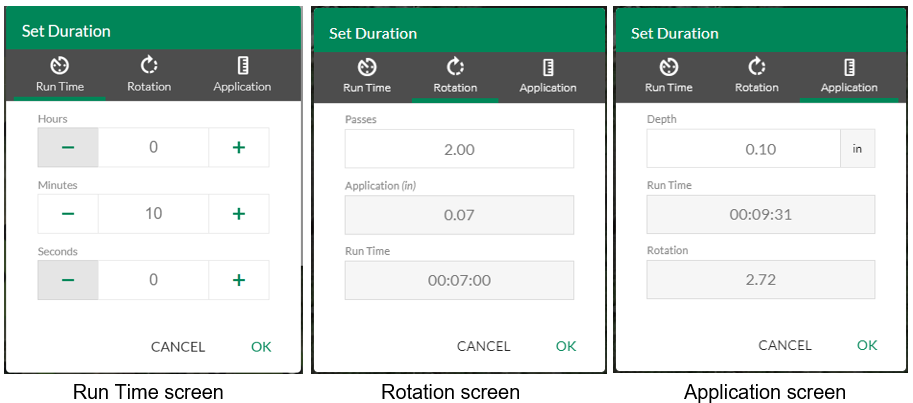
Manual Irrigation by Rotation or Application from the Map:
When selecting a single station from the map and hitting the “start” button, you now have the ability to select the runtime mode between run time, rotation or application.
Note that it is our intention to have this capability also available when using the “Multi-Select” tool as well as in other areas where manual irrigation is possible in upcoming releases.
Shape File Importation:
The “Custom Layer” importation tool in CirrusPRO has been updated to allow direct importation of shapefiles (.shp). Shapefile is the file format used in our “Classic” centrals (Stratus LT, Stratus II, Nimbus II and Cirrus). If you owned a “classic” Rain Bird central control and had a custom map, it is now easy and simple to import your “classic” map into CirrusPRO. To do so:
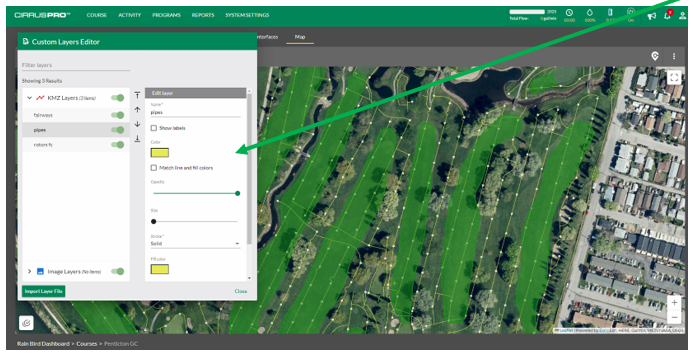
When in “Maps”, click on the “Custom Layer” icon in the top right corner.
![]()
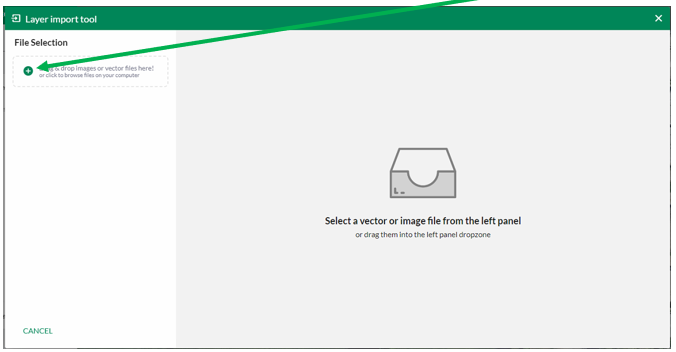
The “Layer import tool” window will show up. To start importing shapefiles, click on the “plus” sign in the top left corner.
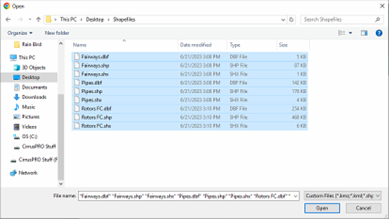
Select your shapefiles from the windows explorer window. Make sure to select all the files (.dbf, .shp, .shx, etc.) that are part of your shapefiles. In the example below, 9 files were selected for the three different layers to import: Fairways, Pipes & Rotors FC)
Once you open your files with the import tool, they will be listed in the left pane:
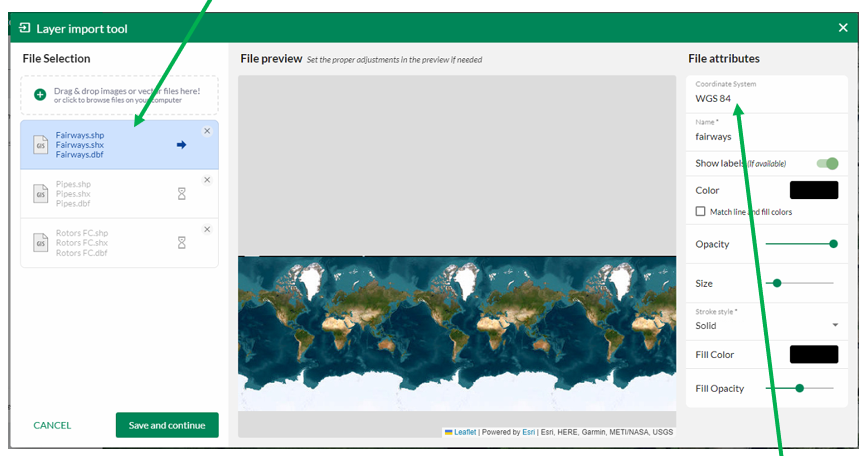
If the selected layer (in blue) does not properly appear over the golf course in the center pane, then you need to select the proper file coordinate system in the box located in the upper right corner. You can remove the “WGS 84” and start typing a location such as a main city, state or country. If you happen to know the exact coordinate system, then simply enter it.
Once you have found and entered the correct coordinate system, your layer should display at the right location over the golf course. As in the example below, your layer will most likely show up in red.
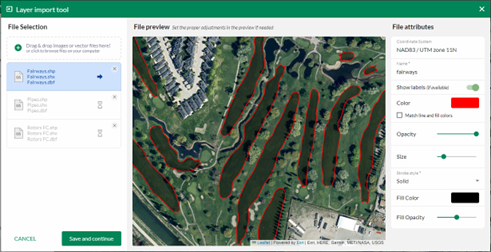
Use the right pane to change the line color, fill color, opacity, size of lines, etc.
When your layer is displayed the way you want it, click on “Save and continue” in the lower left corner of the import tool. The second layer will then be selected, and you will need to enter the right coordinate system again, and then change your layer attributes.
Repeat the process for each layer.
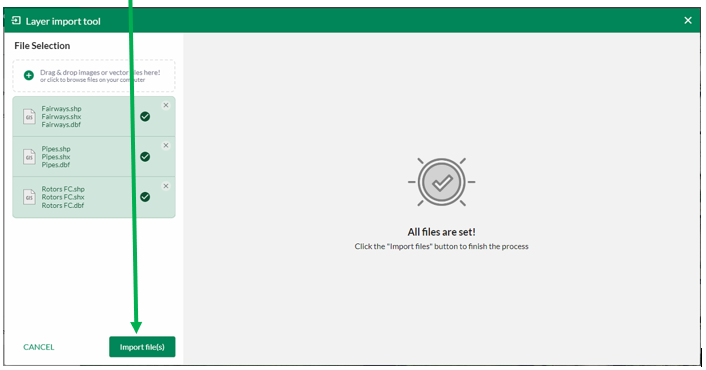
When the attributes of all your layers are completed, you will see a “All files are set!” in the center pane and a “Import file(s)” button in the bottom of the left pane. To finalize importing your layers click on that button.
Your layers should now be displayed on your map. To edit any of the properties of a given layer, just select the layer in the layer menu and attributes can be changes in the right pane.